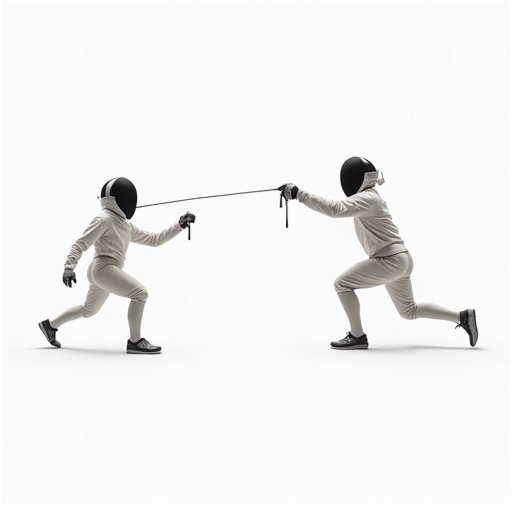
"Cars"
Abstract
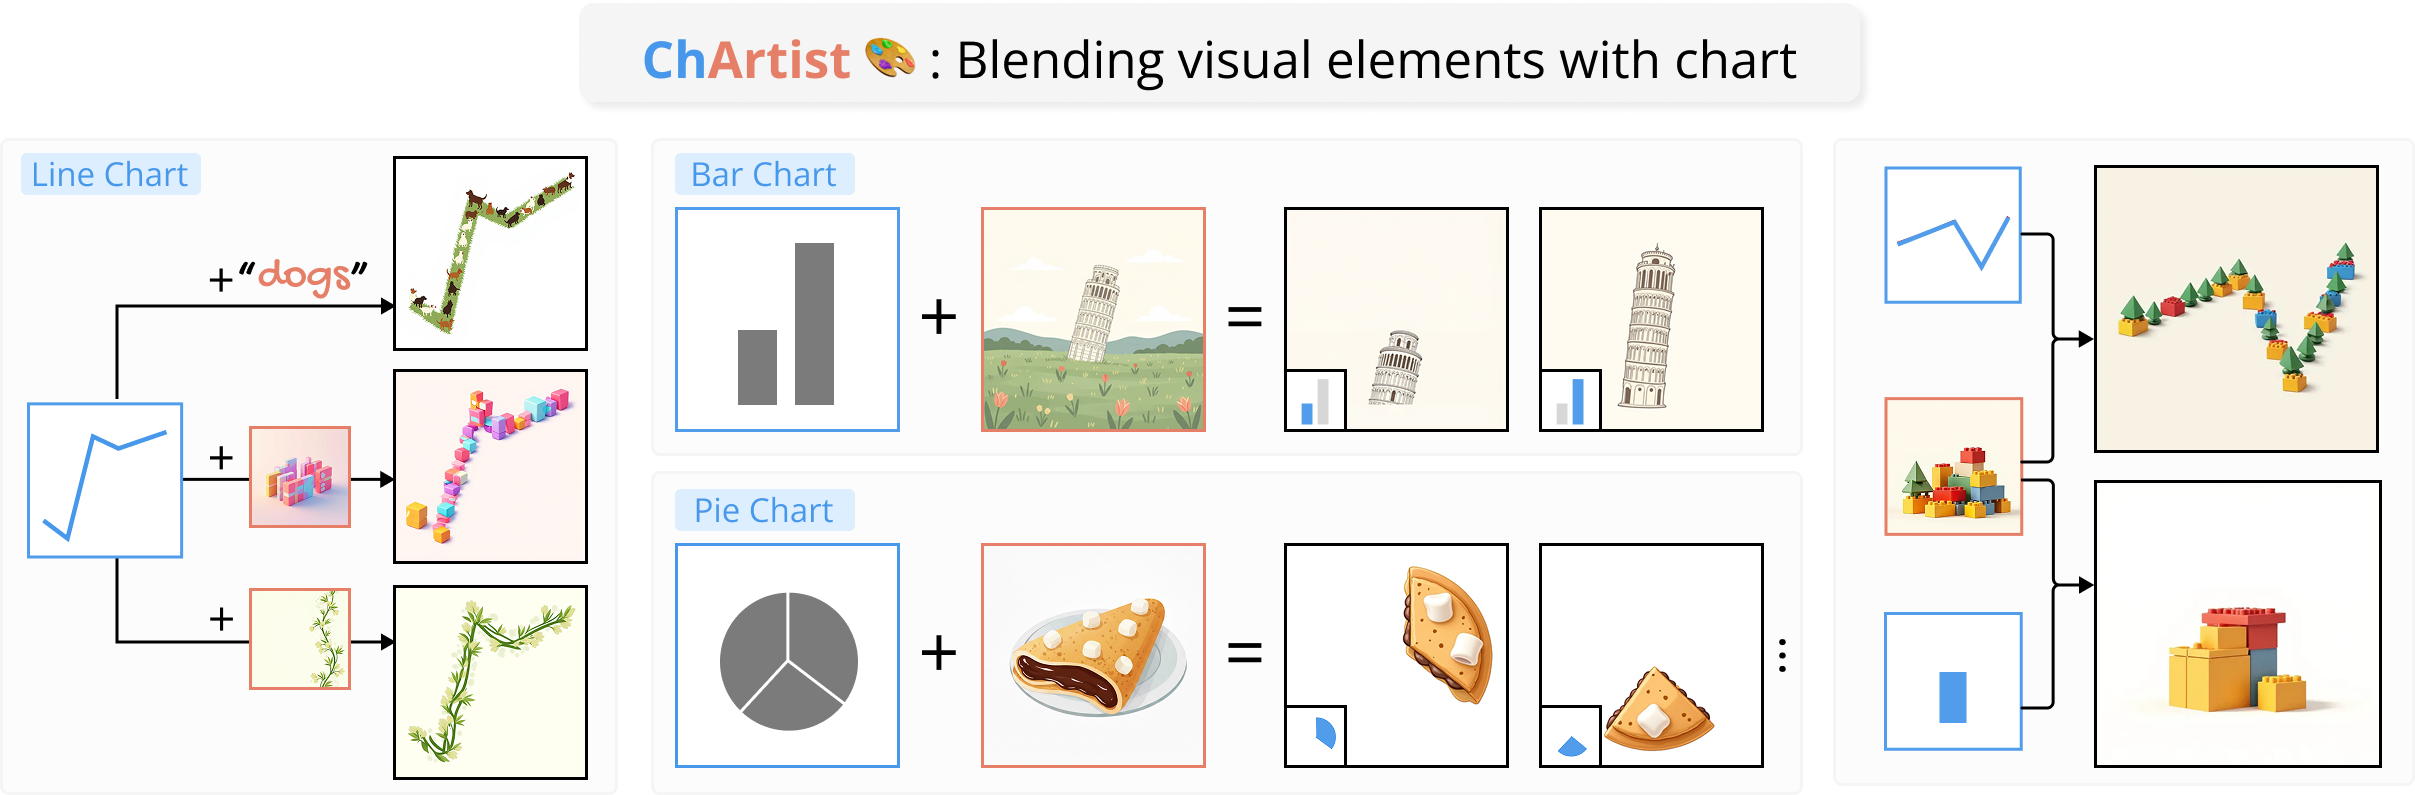
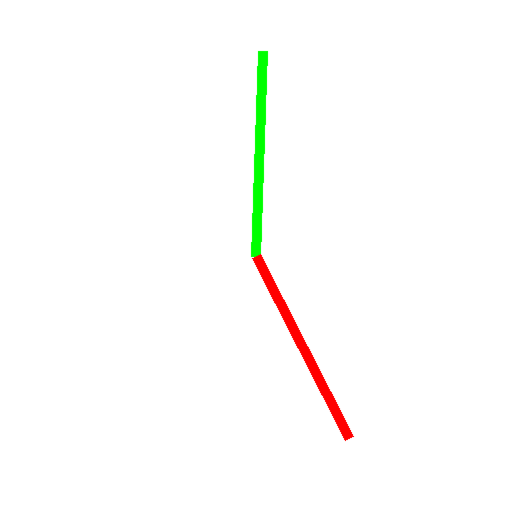
A pictorial chart is an effective medium for visual storytelling, combining visual elements with data charts. However, generating such images is challenging because the flexibility of visual elements often conflicts with the rigid structure required to encode data. We present ChArtist, a domain-specific diffusion model for automatic pictorial chart generation with two complementary controls: (1) spatial control that aligns with chart structure, and (2) subject-driven control that preserves the visual characteristics of a reference image. To enable this, we introduce a skeleton-based spatial representation that encodes only the chart’s data structure, allowing flexible integration of reference visuals without rigid outline constraints. Our method is built on a Diffusion Transformer (DiT) with an adaptive positional encoding mechanism to coordinate these two control signals. We further propose Spatially Gated Attention to regulate the interaction between spatial and subject controls. To facilitate model training, we construct a dataset of 30,000 triplets (skeleton, reference image, pictorial chart) and introduce a unified data accuracy metric to evaluate data faithfulness in generated charts.
What ChArtist can do?
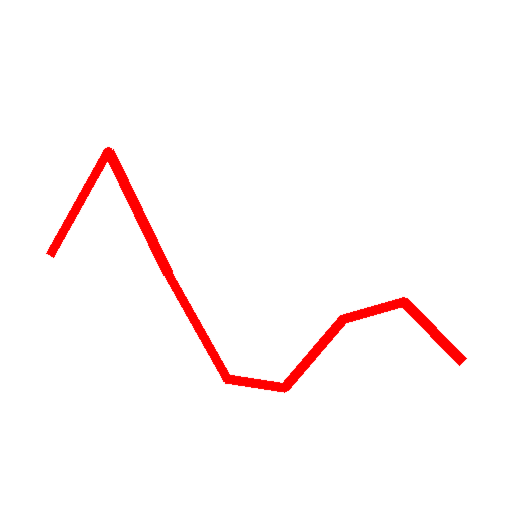
Starting from this line chart, we support two types of generation to make it more informative.
Hover over the text/image to see the generated pictorial chart.

"Crayons"

"Jellyfish"

"Maple leaves"

"Origami cranes"

"Ribbon"

Text-driven Generation


Image-driven Generation
Method
Task-Specific LoRA
We train two lightweight LoRA modules to control generation from different sources: a spatial LoRA  that follows the chart skeleton and a subject LoRA
  that injects the visual appearance from a reference image. These controls can be used independently or combined to support flexible chart creation.
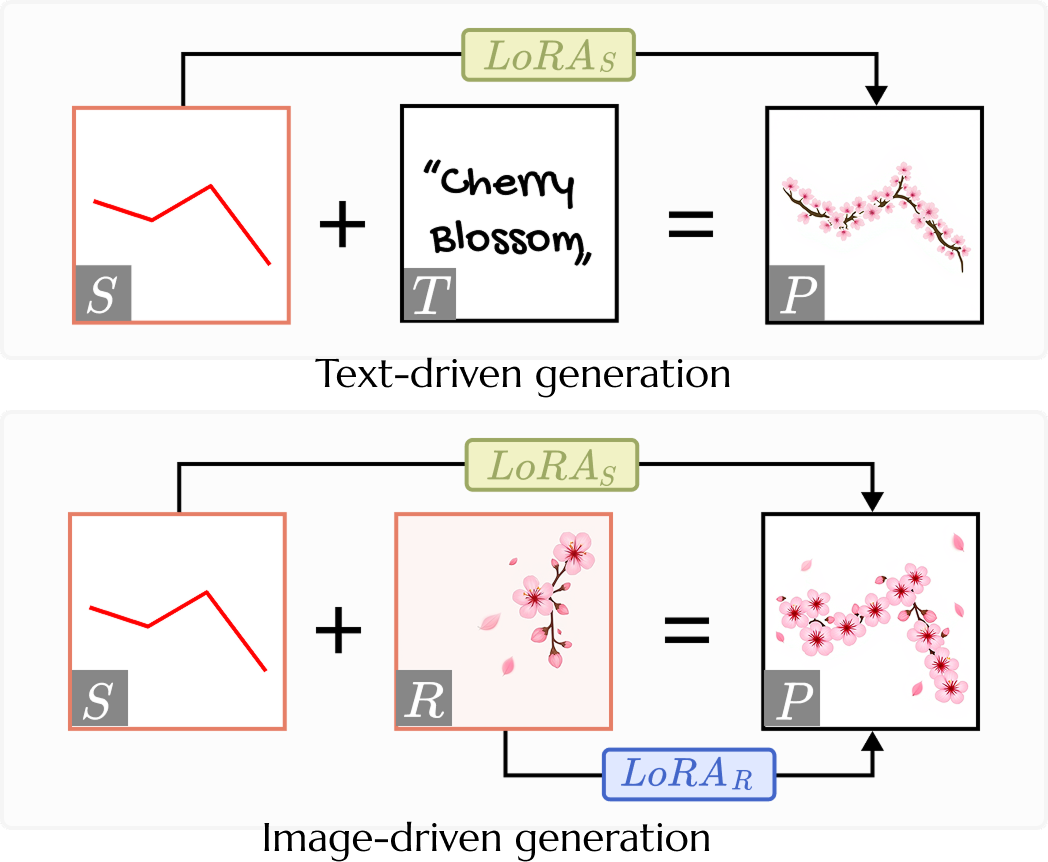
Challenge of Merging Multiple LoRAs
Naively composing multiple LoRAs in parallel introduces cross-condition interference. In pictorial charts, this often leads to structure misalignment or style leakage, where the generated visuals break the chart’s data structure.
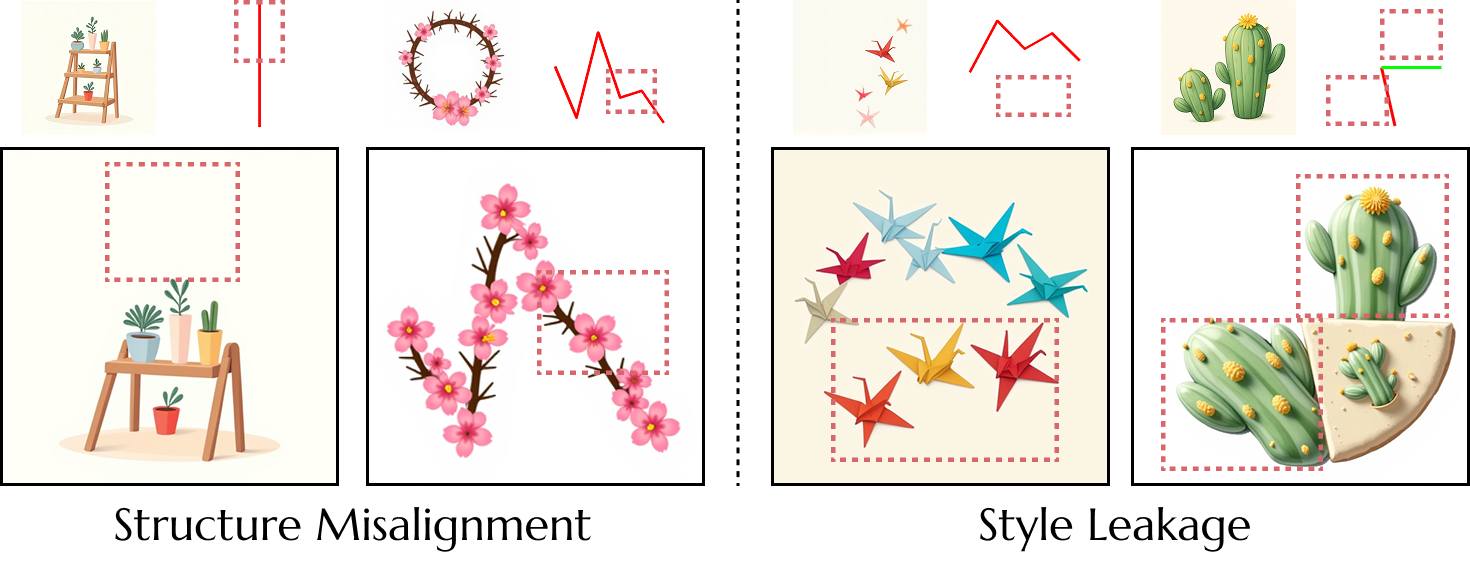
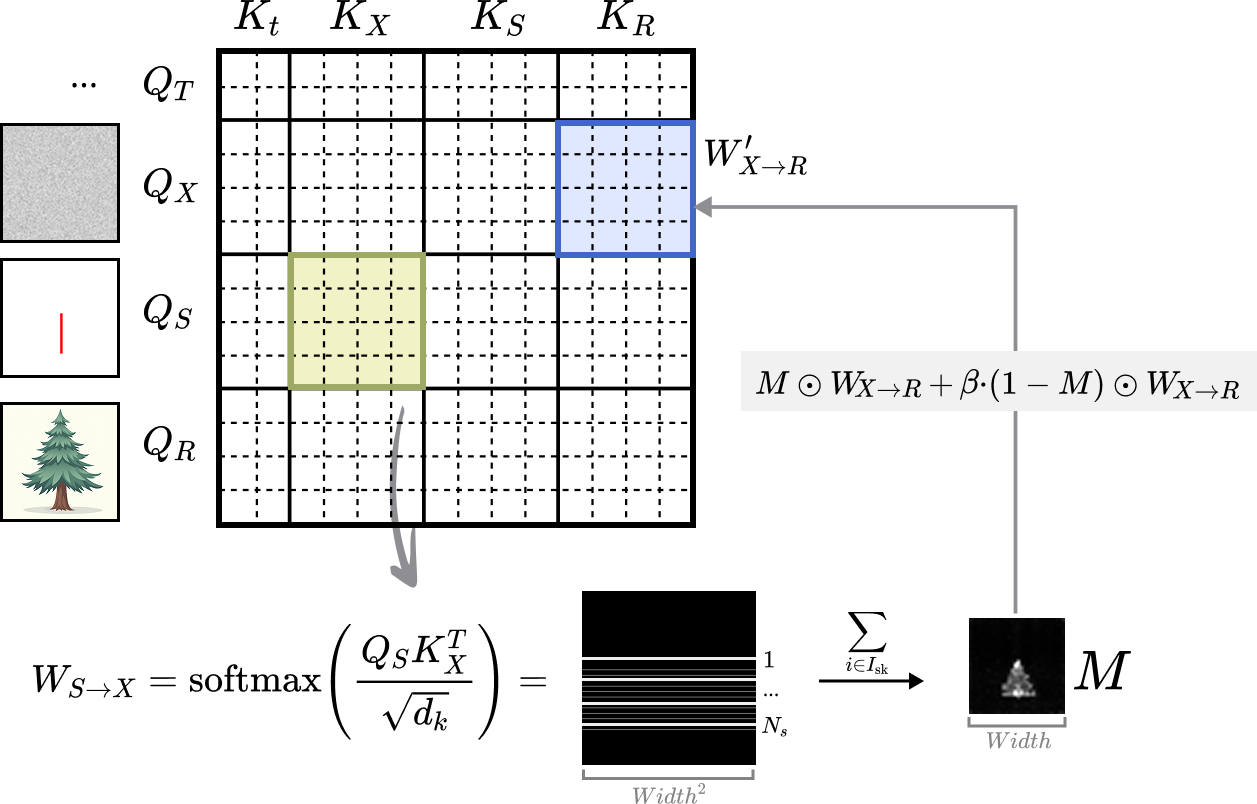
Spatially-Gated Attention
To address the challenge, we use Spatially-Gated Attention to coordinate spatial and subject control. A spatial mask from the chart skeleton gates subject attention so that visual elements remain aligned with the chart structure.
Results
Bar chart
Hover over the result image to compare with the skeleton.
"pagoda tower"
+

=

"cherry blossom"
+

=

"ice cream"
+

=

Text-driven Generation

+


⤷
click to swap
=


+

=


+

=

Image-driven Generation
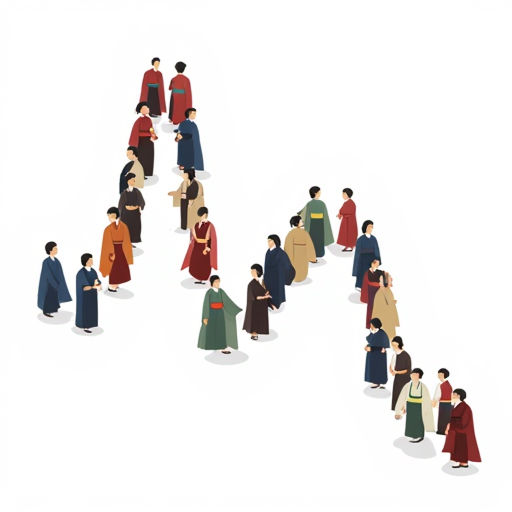
Line chart
Hover over the result image to compare with the skeleton.
"People in kimonos walking"
+
=
"Surfing"
+
=

"Igloos"
+
=

Text-driven Generation

+
⤷
click to swap
=

+
=


+

=

Image-driven Generation
Pie chart
Hover over the result image to compare with the skeleton.
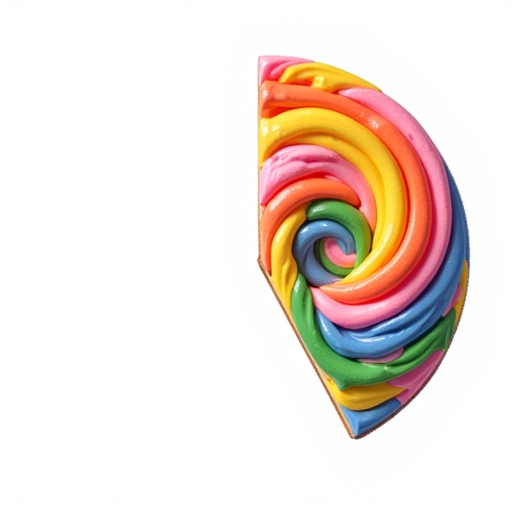
"lollipop"
+
=
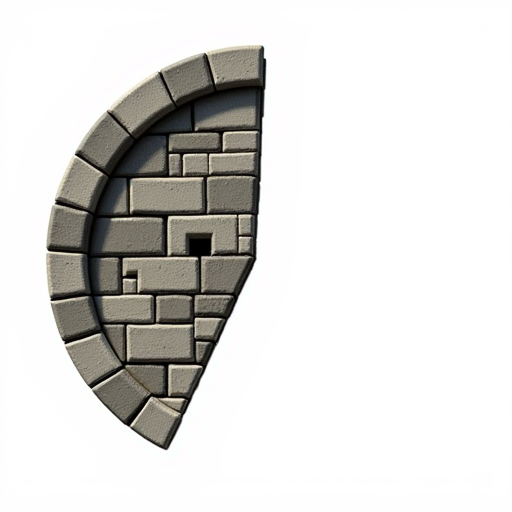
"Castle Turret"
+
=
"purple flower"
+
=

Text-driven Generation

+

⤷
click to swap
=


+
=


+
=
Image-driven Generation
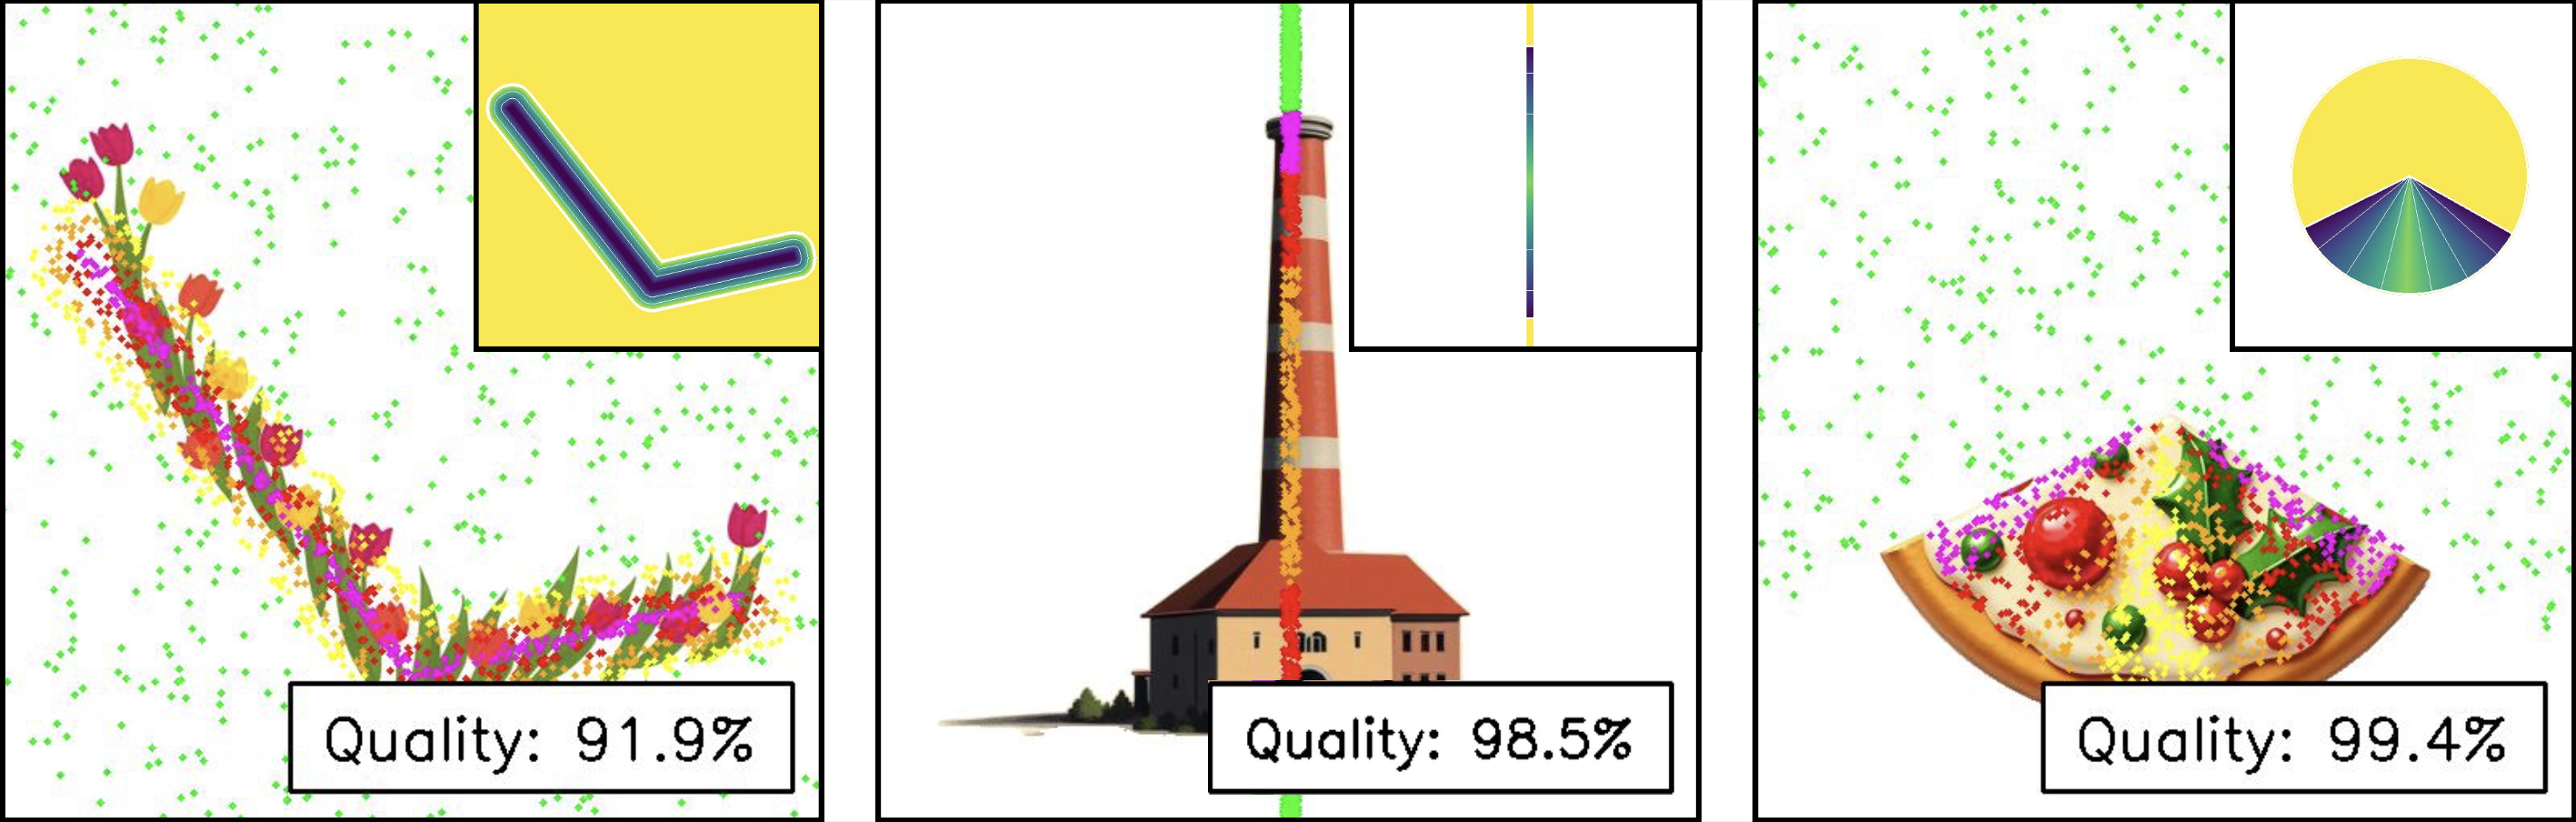
Metric of Data Faithfulness
Preserving the underlying data is critical for pictorial charts. We propose a unified data accuracy metric to measure how well the generated image follows the chart structure. The metric constructs a distance field along the data-encoding dimension and computes a weighted F1 score based on sampled points around the skeleton.
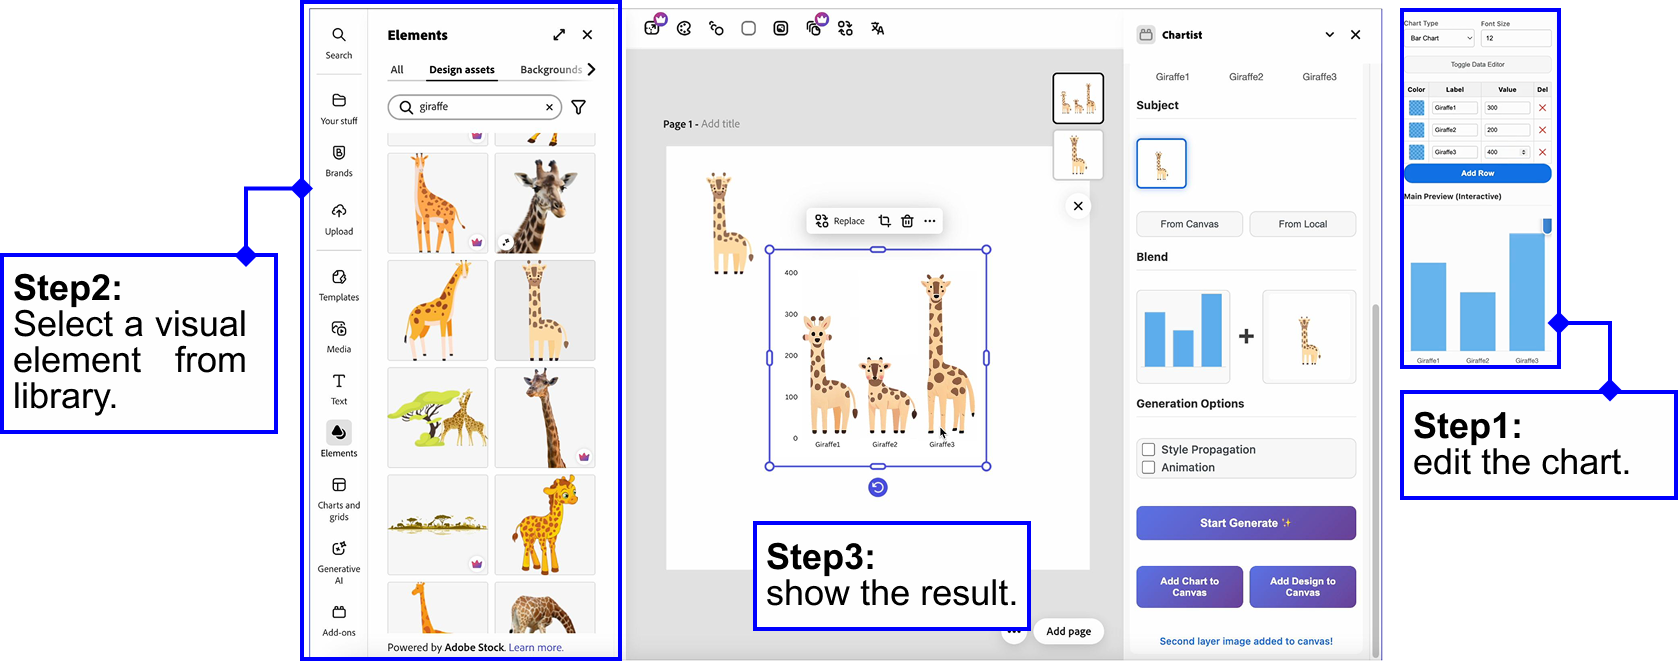
Application
BibTeX
@article{chartis2026,
            title={Generating Pictorial Charts with Unified Spatial and Subject Control},
            author={Shishi Xiao, Tongyu Zhou, David Laidlaw and Gromit Yeuk-Yin Chan},
            journal={arXiv preprint arXiv:XXXX.XXXXX},
            year={2026}
            }